
Nobel Laureate Joseph Stiglitz can stake some claim to being the intellectual father of the ‘Occupy’ movement with his May 2011 Vanity Fair article ‘Of the 1%, by the 1%, for the 1%‘. He followed up with a book in 2012, ‘The Price of Inequality‘. This, in turn, builds on inter alia the 2003 and 2004 scholarly works of Thomas Piketty and Emanuel Saez on income inequality in the US since 1913.

Piketty, Saez and others – including Ireland’s Brian Nolan – have since worked to bring together data on top income shares for some two dozen countries and counting in a consolidated database (complete with helpful interactive graphics).
Piketty and Saez noted the existence of a U-shaped evolution in top income shares in the US between 1913 and 2002. Prior to WWI, wealth and income was heavily skewed towards the wealthy. The top 1% of households accounted for some 18% of income. The combination of the economic shocks of two world wars, the great depression and the introduction of steeply progressive taxation (alongside other structural factors) combined to steadily reduce the income share of the top 1% to less than 10% by the early 1950s, a level below which it would remain for some three decades. From the early 1980s, however, the income share of the top 1% climbed steadily from less than 8% to reach more than 18% by 2006.
How does Ireland’s top 1% compare?
Although Irish data is sparse prior to 1975, we see a similar U-shape in evidence. We have data for Ireland for 1938 and 1943, between which years the income share of the top 1% fell significantly from 16.93% to 12.92% (the corresponding share of the top 1% in the US fell from 14.73% to 10.54% over the same period). Incomes were even more tightly concentrated at the top in Ireland than in the US both before and after WWII. Although we have no further data for Ireland until 1975, we see that the decline in top income shares was even more dramatic there than in the US, the share of the top 1% falling to 5.96% (compared to 8.01% in the US).
If we broaden the comparison to include the UK, France and Denmark – and concentrate on the post-1975 period for which we have sufficient Irish data – we see that the income shares of the top 1% in Ireland track those of the US and the UK higher, albeit without reaching such extreme levels of concentration. By comparison, the income share of the top 1% has remained relatively steady in Denmark, at 5-7%, and in France, at 7-9%, throughout the period.
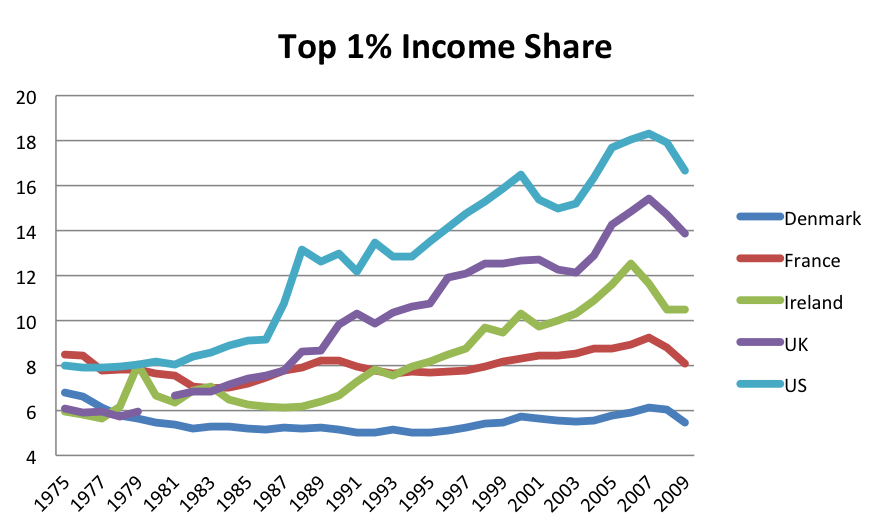
While the concentration of top incomes does not appear to have reached the same extremes in Ireland as in the US or the UK, this may be because Ireland’s economic slump of the 1980s delayed the tendency towards top income concentration at a time when the Reagan/Thatcher revolutions were accelerating such concentrations in the US and UK.
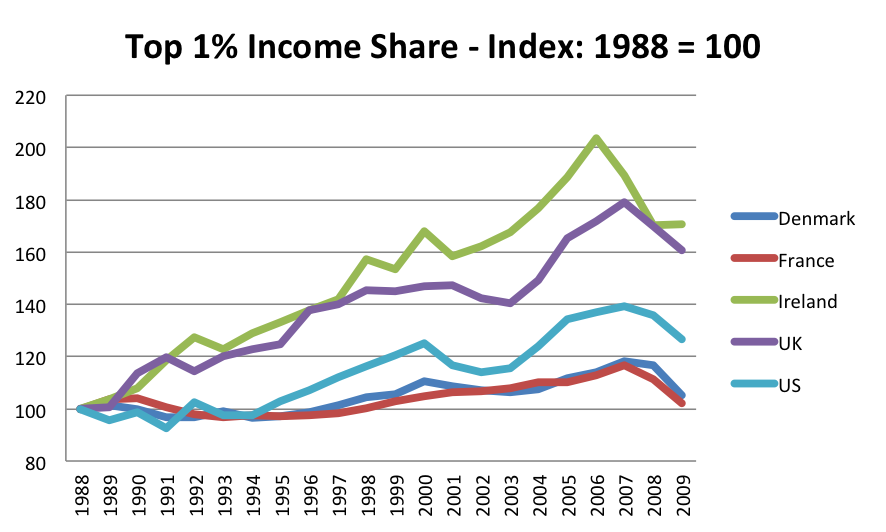
If we look at the evolution of the income shares of the top 1% from 1988 onwards, indexing the 1988 concentration to 100, we see that the share of Ireland’s top 1% had more than doubled, reaching 12.5%, by 2006. The rate of concentration of incomes of the top 1% was therefore far grater in Ireland than in the US or the UK in the two decades since 1988.
The global financial crisis and recession of the late 2000s had a similar impact on top incomes in all countries: large fortunes and big incomes fell further with the onset of crisis, leading to sharp falls in the income shares of the top 1% in all countries.
Preliminary data would suggest that previous trends towards greater concentration of top incomes had reasserted themselves by 2009 and 2010, however, and this requires careful future study. Moreover, the 2010 Survey of Income and Living Conditions signaled a steep increase in income inequality, as measured by the GINI coefficient (although the forthcoming 2011 data and methodological adjustments should establish whether this is a blip or a trend), after a number of years of falling inequality while the ESRI’s analysis of the 2012 and 2013 budgets would suggest that fiscal policy is likely to exacerbate income inequality further.
There is no perfect measure of income inequality, and such measures tell us little about the distribution of assets, or for that matter, true economic and political power. Such measures, including measures of top income shares, are less interesting for what they tell us over the short term, than for the longer term trends they reveal. This snippet of evidence does, however, support the thesis that the anglo-saxon model of economic development is more conducive to high concentrations of income among the highest earners.
