
No, this isn’t about painting the Irish economy as a rotting carcass.
It’s about breaking down Irish GDP into its different components, learning how to read the national accounts, looking at their long-term trends and how they changed when crisis struck from late 2007 onwards.
When economists agree that a certain formula must be true by definition, they call it an ‘identity’. A whole which is the sum of its parts is a good example, and one notable such example is the national income identity based on the sum of all expenditures in an economy in any given year:
Y = C + I + G + X – M
This simply means that Gross Domestic Product (GDP, or Y) is the sum of all personal consumption, investment, government expenditures on goods and services, plus exports, minus imports (ignoring, for the sake of simplicity, statistical discrepancies and changes in stocks or inventories, which are typically quite small in any event).
As net exports are also known as the trade balance (X – M = TB), GDP can be expressed as:
Y = C + I + G + TB
In many countries, this is the end of the story to all extents and purposes, as GDP is typically very close to Gross National Product. Ireland, however, is a small, open economy with a big external sector and FDI presence.
This means that a significant amount of the wealth generated in Ireland is generated by foreign residents, and later repatriated in the form of interest or profits, thereby reducing the amount of wealth generated by Irish residents (by just under a fifth).
In countries such as the US, whose residents have large investments in other countries, not least in Ireland, GNP may actually be larger than GDP. This simply means that the interest and profits generated and repatriated by US investments in other countries outweigh the interest and profits generated and repatriated by the investments of other countries in the US.
The balance of these flows, what are known as ‘factor incomes’ (because essentially they are the remuneration of the factors of production: land, labour, capital and enterprise through rent, wages, interest and profits respectively), is the Net Factor Income from Abroad (NFIA). This gives rise to another simple identity:
GNP = GDP – NFIA
Ireland’s trade surplus and net factor flows have been increasing over time, while GDP peaked in 2007 and hasn’t yet recovered. EUR, millions:

Typically, when reading national accounts data, economists will pay most attention to the data series that is:
1) quarterly (as this is the shortest period for which reliable data is available, rather than waiting for the annual data which is most useful for making comparisons);
2) constant prices (as this strips out the impact of inflation to give a better indication of ‘real’ growth; typically these will be ‘chain linked’, which just means that they are expressed in terms of, for instance, 2010 money);
3) seasonally adjusted (as this strips out seasonal effects like the timing of Easter, which could fall in either March or April: quarter 1 or quarter 2).
This means that we can look at how the economy changes over time without falling into the trap of comparing apples with oranges.
For any given quarter, the Central Statistics Office (CSO) will publish its first estimate of GDP for that quarter 2-3 months after the end of the quarter. The most recent data, for Q3: July-September 2012, was published 18th December. The headline data on page one, which put GDP at €40,012 (GNP at €33,096) for Q3, up 0.2% (down 0.4%) on Q2 refers to the quarterly, seasonally-adjusted figures at constant 2010 prices.
The detailed breakdown of this data series (into C + I + G + X – M) going back to 2007 is contained in table 6 on page 8 of the most recent data publication. While these quarterly ‘first estimates’ are revised, sometimes quite significantly, when more accurate information becomes available, they tend to garner more media attention than the revised, more accurate, data.
So, how has Irish GDP and its constituent components changed over time?
Since Q1 1997, from when the CSO provides comparable quarterly, seasonally adjusted, constant prices data, GDP had doubled by the time it peaked just over ten years later in Q4 2007. It fell by a little over 10% (‘peak to trough’) before bottoming out two years later in Q4 2009. It has since grown in 8 quarters, falling in 3 signaling a slow, uneven, return to growth far below both its average rate over the last two decades and what economists consider to be its potential growth rate.
The evolution of the components of Irish GDP has diverged over time. Index: Q1 1997 = 1
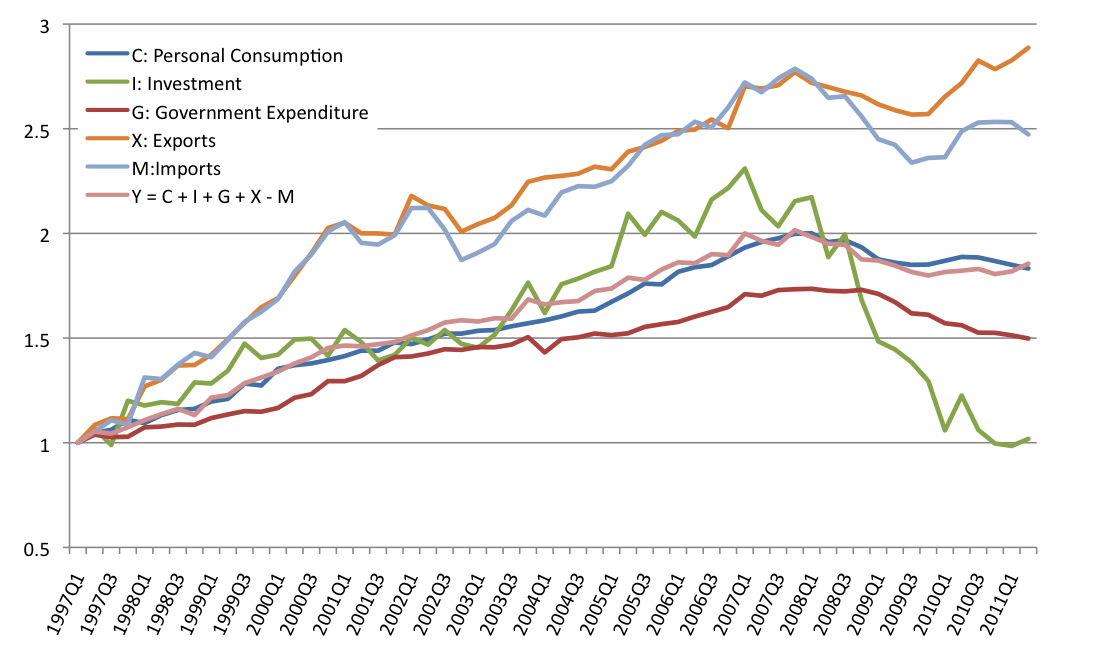
Looking at GDP’s various components, we get a more nuanced view of Ireland’s recent economic history:
1) Personal consumption accounts for roughly half of, and therefore moves broadly in line with, GDP. From its 1997 level, consumption had doubled by the time it peaked in Q1 2008, a quarter later than GDP.
2) From its 1997 level, investment in Ireland had increased by a factor of 2.3 by the time it peaked in early 2007. It has since collapsed back to 1997 levels, and has shown little sign of recovery. Investment – or Gross Domestic Fixed Capital Formation in economists’ jargon – tends to be more volatile than consumption, and responds more slowly to changing economic conditions: whereas people still need to eat, buy clothes and generally consumer a certain amount even though their income goes up and down, they can put off buying a house or making similar investments while firms have even more flexibility in terms of whether and when to invest. Investment tends, for instance, to be more responsive to the prevailing interest rate and to the ‘wealth effect’ induced by changing asset prices (and debt levels / overhangs).
3) Net expenditure by local and central Government, like consumption, also peaked in Q1 2008. It had increased only by three quarters since 1997 lagging growth in consumption and GDP, which had both doubled. After 6 austerity budgets, net government expenditure on goods and services (welfare payments, for instance, are not included as they are considered to be transfers – re-distribution – rather than expenditure) had fallen by nearly 19% by Q3 2012, with this trend likely to continue for several more years.
4) Exports have increased by a factor of 3 since 1997 and stand near their all-time high set in Q1 2012, despite having fallen some 7.3% from their previous Q4 2007 peak by Q3 2009 with the onset of global economic and financial crisis. In fact, Irish exports were relatively resilient during this period, falling far less than overall global trade flows.
5) Imports move also in lock-step with exports, signaling the very high import dependency of Irish exports. This means that much of Ireland’s exports involve the re-export of goods and services the components for which are first imported. This reflects Ireland’s integration with global supply and value chains. Imports and exports diverged slightly during two periods: from early 2002 to late 2004, and from early 2008 onwards. These divergences likely result from relatively weak growth in domestic demand (i.e. consumption, investment and government expenditures) following the recessions in 2001 and 2008-. Continued export strength and weak domestic demand since 2008 have contributed to a record widening in Ireland’s trade surplus.
6) Tracking Ireland’s impressive export performance, albeit with more volatility, is the increasingly negative NFIA which,exports, had increased by a factor of 3 by end 2011. These Net Factor Flows tend to be more volatile because they reflect the investment and profit repatriation decisions of the multinational sector, whose preferences may change over time. This also explains why GNP tends to be more volatile than GDP.
How has the share of the components in GDP changed over time?
The share of Consumption in GDP has remained remarkably stable around 50% in the decade and a half since 1997.
The share of Government expenditure has trended downwards from just under 20% over this time, slowly at first, and more steeply since early 2009 as austerity has taken hold to stand at just under 15% by Q3 2012.

Ireland’s Investment rate remained reasonably stable in a 19-24% range between 1997 and late 2008 before halving to stand at a little over 10% by Q3 2012. While there was certainly over-investment in the middle of the last decade, Ireland is now experiencing significant under-investment as government slashes its capital programme to balance the books, while firms and families buckling under a burdensome debt overhang are either busy paying down debt or are unable or unwilling to invest. For this reason, Ireland currently has both a relatively high savings rate and historically low investment rate. As the debt burden is gradually relieved, and bottleknecks build up in the economy (e.g. families will need to replace cars and buy new houses as the population continues to expand quickly; there is little further scope for cutting government capital programmes; and firms will eventually have to replace equipment), the only way is up for investment, albeit from a very low base.
The Trade Balance, or net exports, has increased from less than 5% of GDP in Q4 1998 to reach over 28% by mid 2012. As recently as Q4 2006, the trade balance had dipped below 6% on the back of Ireland’s debt and import fuelled investment boom. As this investment bubble dramatically burst, consumption-related imports have fallen back significantly in recent years while exports have been setting new records. These trends look set to continue in the short-to-medium term.
